
Most developers use Chrome DevTools every day.
But most of us only use a small part of what it can actually do.
Chrome DevTools has lots of hidden features that can save you time while debugging. You can force hover states, capture full-page screenshots, throttle your network, edit a page live, run commands quickly, and much more.
In this article, I’ll share 19 Chrome DevTools tricks that can help you debug faster and work more efficiently.
Let’s jump right into it! 🚀
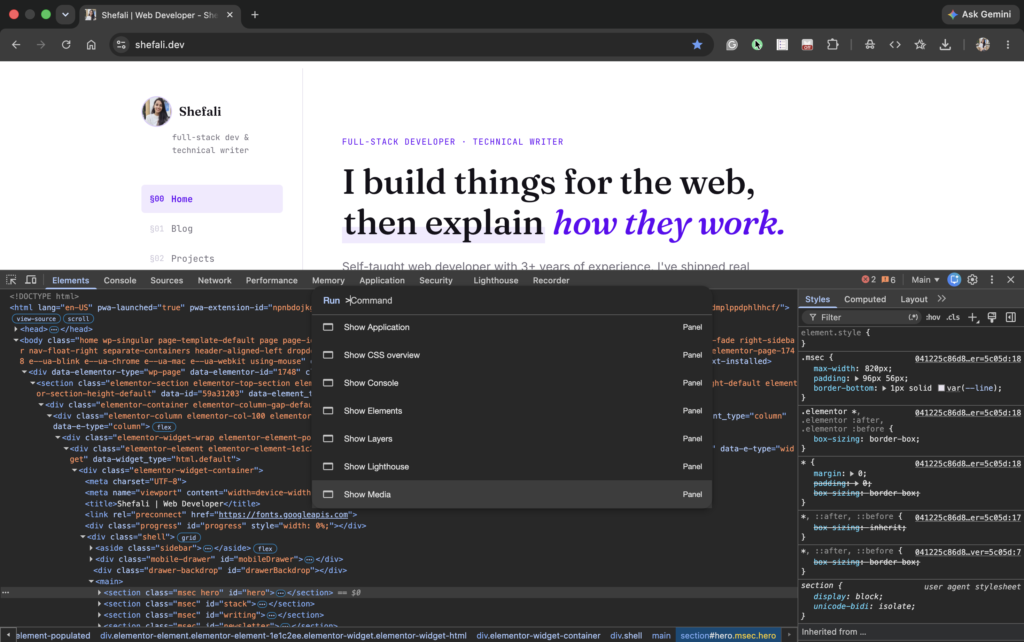
1. The Command Palette
Just like VS Code, Chrome DevTools also has a Command Palette. Press Ctrl + Shift + P (Cmd + Shift + P on Mac) while DevTools is open, and you can quickly search for almost any feature, like screenshots, themes, panels, sensors, and more.
It’s much faster than clicking through different menus, and many developers don’t even know it exists.
2. Take a Full-Page Screenshot
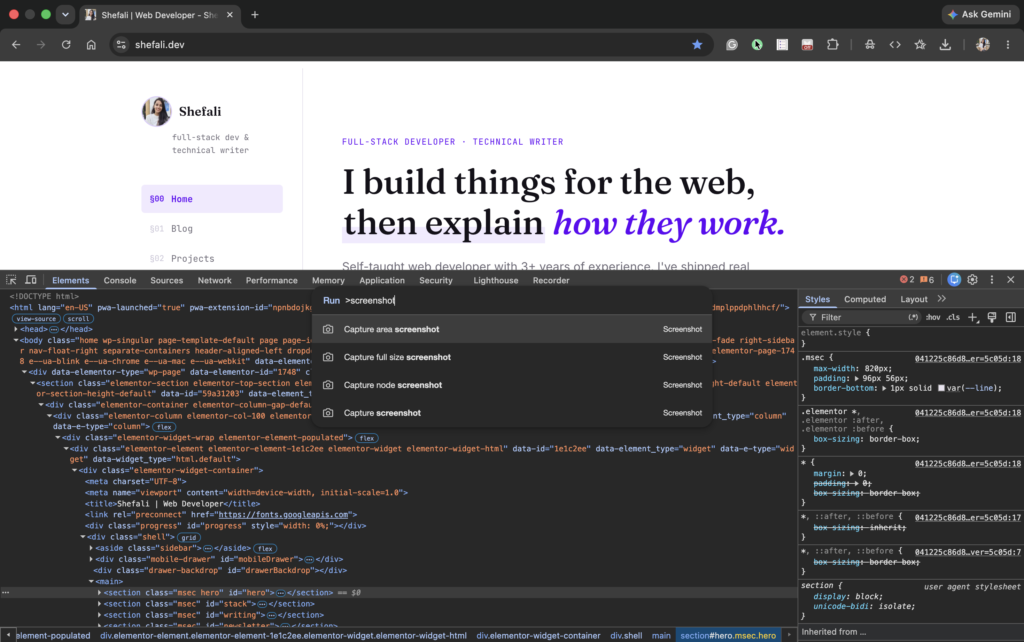
You don’t need a browser extension to take a full-page screenshot.
Open the command palette (Ctrl+Shift+P), type screenshot, and select Capture full size screenshot. DevTools will automatically capture the entire page and save it as a PNG.
You can also capture just a specific element by choosing Capture node screenshot.
3. Force Element States
Testing hover styles doesn’t have to mean keeping your mouse perfectly still.
In the Elements panel, select an element, open the Styles tab, and click :hov. From there, you can force states like :hover, :focus, :active, :visited, and :focus-visible.
It’s a quick way to debug hover effects, dropdown menus, focus rings, and other interactive states.
4. Edit Any Text on the Page
Open the Console and run:
document.designMode = 'on'
The entire page becomes editable. You can click anywhere and start typing.
It’s a handy trick for testing different text, mocking up UI changes, or replacing placeholder content before taking screenshots.
5. Reference the Selected Element in Console
Every time you select an element in the Elements panel, DevTools automatically saves it as $0 in the Console.
Type $0 and press Enter to inspect the element, access its properties, or run methods on it.
You can also use $1, $2, $3, and $4 to access the previously selected elements. This makes switching between elements much faster while debugging.
6. Pretty Print Minified Code
Minified JavaScript and CSS files can be hard to read while debugging.
Open the file in the Sources panel and click the {} button at the bottom. DevTools will instantly format the code and make it much easier to read. You don’t need to copy and paste it into an external formatter.
7. Throttle the Network
Open the Network panel and click the No throttling dropdown. From there, you can simulate Slow 3G, Fast 3G, or even create a custom network profile.
It’s a simple way to see how your website performs on slower connections and catch performance issues before your users do.
8. Block Specific Requests
In the Network panel, right-click any request and select Block request URL. DevTools will block that resource every time you reload the page.
This is a great way to test how your site behaves when an API fails, a font doesn’t load, or a third-party script is unavailable, all without changing your code.
9. Colour Format Switcher
Click the color swatch next to any CSS color in the Styles panel to open the color picker.
If you Shift + click the swatch instead, DevTools will cycle through different color formats like HEX, RGB, HSL, and HWB.
It’s a quick way to convert colors without using an external tool.
10. Increment CSS Values with Keyboard
Click any numeric CSS value in the Styles panel, then use these shortcuts:
- ↑ / ↓ – Increase or decrease by 1
- Shift + ↑ / ↓ – Increase or decrease by 10
- Alt + ↑ / ↓ – Increase or decrease by 0.1
These shortcuts make it much faster to fine-tune spacing, font sizes, border radius, and other CSS values.
11. Find Unused CSS and JS
Open the Coverage panel (you can find it under More tools). Click the Record button, then reload or interact with your page.
DevTools will show exactly how much of your CSS and JavaScript was actually used, along with the unused percentage.
It’s a great way to find unused code and optimize your website.
12. Emulate Any Device
Click the Device Toolbar icon (or press Ctrl + Shift + M) to open Responsive Design Mode.
You can test your website on preset devices, enter custom screen sizes, and change the device pixel ratio (DPR).
You can also click Edit to add your own custom devices, which is useful when you need to test on a specific phone or tablet.
13. Emulate a Dark or Light Colour Scheme
In the Styles panel, click the brush icon in the toolbar to open the Rendering Emulations menu.
From there, you can switch prefers-color-scheme between light and dark without changing your operating system settings.
14. Copy CSS for Any Element
Right-click any element in the Elements panel and hover over Copy to see several useful options.
- Copy styles: Copies all the CSS styles applied to the element.
- Copy selector: Copies a unique CSS selector for the element.
- Copy JS path: Copies the
document.querySelector(...)path for that element.
These shortcuts save time and make debugging much easier.
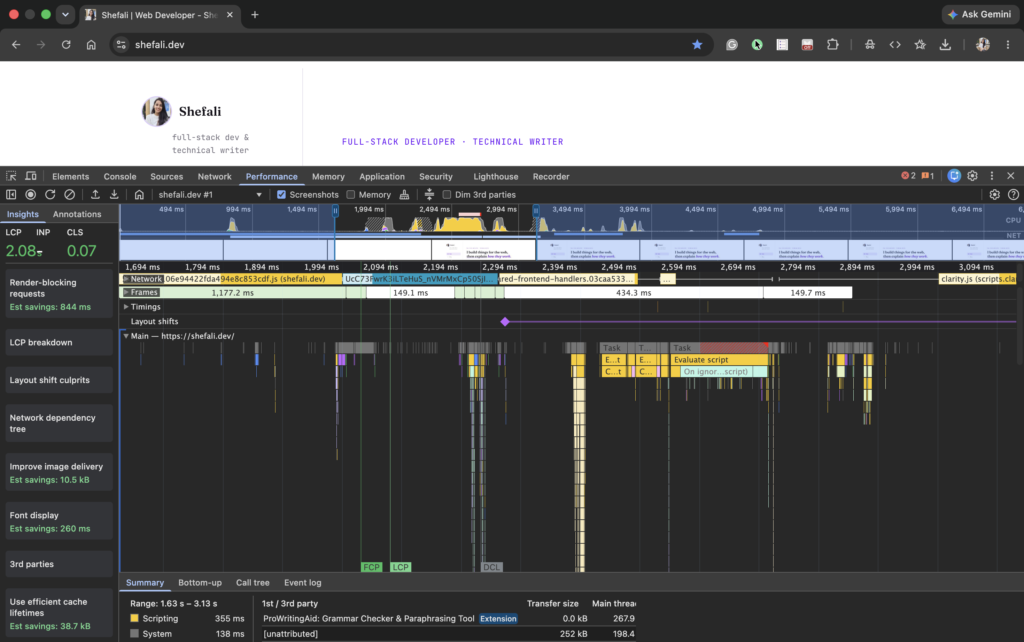
15. The Performance Panel: Record and Identify Bottlenecks
Open the Performance panel, click Record.
DevTools will show a detailed timeline of everything that happened, including JavaScript execution, rendering, and painting.
Pay attention to long tasks (highlighted in red). They’re often the reason your page feels slow or unresponsive.
16. Lighthouse: Run an Audit Right From DevTools
The Lighthouse panel is built right into Chrome DevTools.
Click Analyze page load to generate a report for Performance, Accessibility, Best Practices, and SEO.
You’ll also get practical recommendations to help improve your website, without the need of any extensions or external tools.
17. Local Overrides: Edit Files and Make Changes Persist
By default, any changes you make in DevTools are lost when you reload the page.
With Local Overrides, you can save those changes locally so they persist across reloads.
Open Sources → Overrides, enable it, and choose a local folder. After that, any edits you make to CSS or JavaScript files will be loaded from your local folder instead of the server until you turn Overrides off.
18. Watch Expressions
While debugging, you can add Watch Expressions in the Sources panel to keep an eye on specific JavaScript values.
You can add expressions like user.id, items.length, or this.state, and DevTools will automatically update their values every time execution pauses at a breakpoint.
This makes debugging much easier since you don’t have to keep hovering over variables or using console.log().
19. Drag and Drop Elements in the DOM
In the Elements panel, you can drag and drop any element to a different position in the DOM.
As soon as you move it, the page updates instantly.
It’s a quick way to test layout changes, reorder elements, or see how a different page structure looks without editing your code.
That’s all for today!
I hope these Chrome DevTools tricks save you time.
If you enjoy my work and want to support what I do, buy me a coffee!
Every small gesture keeps me going! 💛
Follow me on X (Twitter) to get daily web development tips & insights.
Enjoyed reading? You may also find these articles helpful.
24 Modern CSS Tricks Every Frontend Developer Should Know